The report divides Sydney's 600 plus suburbs into five quintiles based on their current median house prices, and then picks the top five performers from each group over the past year.
Certain suburbs are excluded based on benchmarks and trends relating to house prices, days on market, sales volumes, inventory and more over the previous three moths.
The suburbs were then ranked based on median house price growth over the past 12 months.
The five quintiles were categorised as the following: Working Class Sydney, Suburban Sydney, Rising Sydney, Professional Sydney, and Elite Sydney.
In the top-performing Working Class suburb, Austral, the median house price increased by $360,500 over the year to February 2022.
This is compared to the median house price in Bellevue Hill, Elite Sydney's top suburb, which rose an 'extraordinary' $4.2 million over the past year.
Shore Financial CEO Theo Chambers said the quarterly report provides a great insight into how the Sydney property market has boomed over the past year.
"For most of the suburbs in the report, inventory levels are under two months and days on market are under 30 days," Mr Chambers said.
"In other words, supply is low and demand is high. The numbers might look very different this time next year, because the evidence suggests the Sydney market is softening.
"But for the past 12 months and also right now, Sydney has been a seller’s market."
It's worth noting that many of the suburbs listed were up to a 90-minute drive from Sydney's CBD, such as those on the Central Coast.
Top five Working Class suburbs
The top five Working Class suburbs all had median house prices of under $900,000, compared to Sydney's current median house price of $1.6 million.
Median house prices also rose by at least $200,000 over the past year.
| Rank | Suburb | Median house price | Median house price growth over the past year |
| 1 | Austral | $860,000 | $360,500 |
| 2 | Summerland Point | $800,000 | $250,000 |
| 3 | Canton Beach | $840,000 | $235,000 |
| 4 | Noraville | $815,000 | $220,000 |
| 5 | The Entrance | $840,000 | $218,500 |
Source: Shore Financial
Top five Suburban suburbs
The top five suburban suburbs inched closer to the $900k mark but were still under this price point.
Median house prices also increased by over $100,000 in each of these suburbs.
| Rank | Suburb | Median house price | Median house price growth over the past year |
| 1 | Box Hill | $882,000 | $265,000 |
| 2 | Appin | $895,000 | $165,000 |
| 3 | Bonnyrigg | $889,000 | $143,000 |
| 4 | Lansvale | $878,000 | $122,000 |
| 5 | Horningsea Park | $885,000 | $115,000 |
Source: Shore Financial
Top five Rising suburbs
The Rising Sydney suburbs all boasted median house prices of over $1 million.
House prices also grew by over $470,000 in the past year.
| Rank | Suburb | Median house price | Median house price growth over the past year |
| 1 | Wamberal | $1,645,000 | $554,000 |
| 2 | Scotland Island | $1,450,000 | $525,000 |
| 3 | Loftus | $1,450,000 | $505,000 |
| 4 | Yarrawarrah | $1,500,000 | $480,000 |
| 5 | Erina | $1,050,000 | $476,000 |
Source: Shore Financial
Top five Professional suburbs
These suburbs all had median house prices of over $2 million and saw house price growth of over $680,000.
In the top-performing suburb, Taren Point, house prices grew by almost $1 million over the past 12 months.
| Rank | Suburb | Median house price | Median house price growth over the past year |
| 1 | Taren Point | $2,300,000 | $969,000 |
| 2 | Narraweena | $2,310,000 | $706,200 |
| 3 | North Ryde | $2,303,000 | $696,300 |
| 4 | Glenorie | $2,305,000 | $690,000 |
| 5 | Monterey | $2,160,000 | $680,000 |
Source: Shore Financial
Top five Elite suburbs
The most expensive suburbs mentioned were in Elite Sydney, with two median house prices over $8 million.
House prices also grew by at least $1.7 million in all five suburbs.
| Rank | Suburb | Median house price | Median house price growth over the past year |
| 1 | Bellevue Hill | $8,410,000 | $4,213,637 |
| 2 | Vaucluse | $8,175,000 | $2,774,000 |
| 3 | Clontarf | $5,340,000 | $2,015,000 |
| 4 | Bronte | $5,400,000 | $1,950,000 |
| 5 | Narrabeen | $4,050,000 | $1,750,000 |
Source: Shore Financial
Advertisement
Buying a home or looking to refinance? The table below features home loans with some of the lowest interest rates on the market for owner occupiers.
| Lender | Home Loan | Interest Rate | Comparison Rate* | Monthly Repayment | Repayment type | Rate Type | Offset | Redraw | Ongoing Fees | Upfront Fees | Max LVR | Lump Sum Repayment | Additional Repayments | Split Loan Option | Tags | Row Tags | Features | Link | Compare | Promoted Product | Disclosure |
|---|---|---|---|---|---|---|---|---|---|---|---|---|---|---|---|---|---|---|---|---|---|
5.79% p.a. | 5.83% p.a. | $2,931 | Principal & Interest | Variable | $0 | $530 | 90% |
| Promoted | Disclosure | |||||||||||
5.74% p.a. | 5.65% p.a. | $2,915 | Principal & Interest | Variable | $0 | $0 | 80% |
| Promoted | Disclosure | |||||||||||
5.84% p.a. | 6.08% p.a. | $2,947 | Principal & Interest | Variable | $250 | $250 | 60% |
| Promoted | Disclosure |
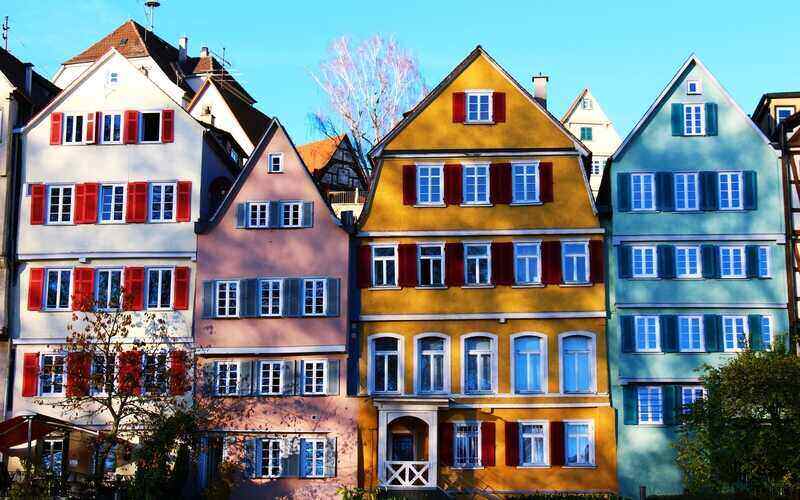
Image by Jamie Davies on Unsplash

Ready, Set, Buy!
Learn everything you need to know about buying property – from choosing the right property and home loan, to the purchasing process, tips to save money and more!
With bonus Q&A sheet and Crossword!


 Harry O'Sullivan
 Jacob Cocciolone
 Denise Raward