PRD’s special report on ‘Olympics 2032: The Year after Announcement’ revealed Brisbane’s property market will likely benefit from the international event if previous history is any indication.
PRD Chief Economist Dr Diaswati Mardiasmo said while the Olympics is 10 years away, past games could give a glimpse as to what could happen with the property market.
“The Olympics had long-term effects on previous host cities, with a strong tendency for housing supply and demand to increase, leading to healthy price growth,” Dr Mardiasmo said.
“This is often due to athletes’ villages in main CBD areas [Sydney, Tokyo, and Beijing] becoming vacant and serving as build-to-rent and market accomodation for a variety of owner-occupiers and investors.
“The issue with the Olympics and other international games is that a lack of planning and management can lead to an underutilisation of new supply, as seen in Rio and Athens."
To avoid falling into a similar trap, the Queensland Government is planning to repurpose the athletes' village in Northshore-Hamilton to include new residential, retail, and commercial opportunities.
It is predicted this new land supply will bring $500 million in private investment and create 1,600 construction jobs.
Which suburbs will record high price growth post 2032 Olympics?
The PRD research team closely examined the impact on the property market of major events such as the Sydney Olympics in 2000, Brisbane’s Expo 88, and the G20 Summit in 2014 to find out median house price growth.
According to the report, median house prices grew 14.3% in the year after each individual event.
By applying this to 2022 median house prices, the PRD Research Team were able to compile a list of the Brisbane suburbs that will experience strong property price growth post-Olympics.
The following suburbs will become $1 million areas:
- Woolloongabba ($1,588,700)
- South Brisbane (1,525,905)
- Herston ($1,779,651)
- Spring Hill ($1,571,625)
- Twin Waters ($1,657,350)
Suburbs that just miss the cut include Tennyson ($972,687) and Broadbeach ($880,110).

Source: PRD Olympics 2032 Report
The PRD Research Team also examined house prices between 2003 and 2015, the decade surrounding the G20 Summit in Brisbane.
In particular, they looked at South Brisbane around the Brisbane Convention and Exhibition Centre where the world leaders met.
During this time, median house prices rose by 111.6%, from $426,000 to $965,000.
If a similar event were to occur for the 2032 Olympics, suburbs such as Hamilton and Chandler would break the $4 million median price mark.
“It is evident that hosting either an international and/or sporting event plays a role in positively impacting property price growth,” the PRD Research Team said.
“History tells us that Brisbane’s property market enjoyed price growth after it hosted international events.
“Despite the recent cash rate hikes, we are already seeing high price growth in key suburbs and areas related to the 2032 Olympics, which further confirms the resilience of property prices in these areas.”
The report noted that the 2018 Gold Coast Commonwealth Games was an exception, recording minimal property price growth post-games.
Do employment and population growth play a part?
It is estimated the Games will bring $8 billion of economic and social benefits to the sunshine state, including the creation of approximately 91,600 full-time jobs.
“Job creation is one of the main recipes to property price growth, as it increases people’s purchasing power and their ability to enter the market,” Dr Mardiasmo said.
“Further, the Olympics attracts population growth into the region which increases demand for housing.
“Combined with the current lag in supply, such an imbalance can lead to further property price growth.”
The suburbs which have showcased plans for future housing supply include Coomera, Broadbeach, Woolloongabba, South Brisbane, Redland Bay, and Ipswich.

Source: PRD Olympics 2032 Report
Advertisement
Buying a home or looking to refinance? The table below features home loans with some of the lowest interest rates on the market for owner occupiers.
| Lender | Home Loan | Interest Rate | Comparison Rate* | Monthly Repayment | Repayment type | Rate Type | Offset | Redraw | Ongoing Fees | Upfront Fees | Max LVR | Lump Sum Repayment | Additional Repayments | Split Loan Option | Tags | Features | Link | Compare | Promoted Product | Disclosure |
|---|---|---|---|---|---|---|---|---|---|---|---|---|---|---|---|---|---|---|---|---|
5.79% p.a. | 5.83% p.a. | $2,931 | Principal & Interest | Variable | $0 | $530 | 90% |
| Promoted | Disclosure | ||||||||||
5.74% p.a. | 5.65% p.a. | $2,915 | Principal & Interest | Variable | $0 | $0 | 80% | 100% owned by Commbank |
| Promoted | Disclosure | |||||||||
5.84% p.a. | 6.08% p.a. | $2,947 | Principal & Interest | Variable | $250 | $250 | 60% | 100% offset |
|
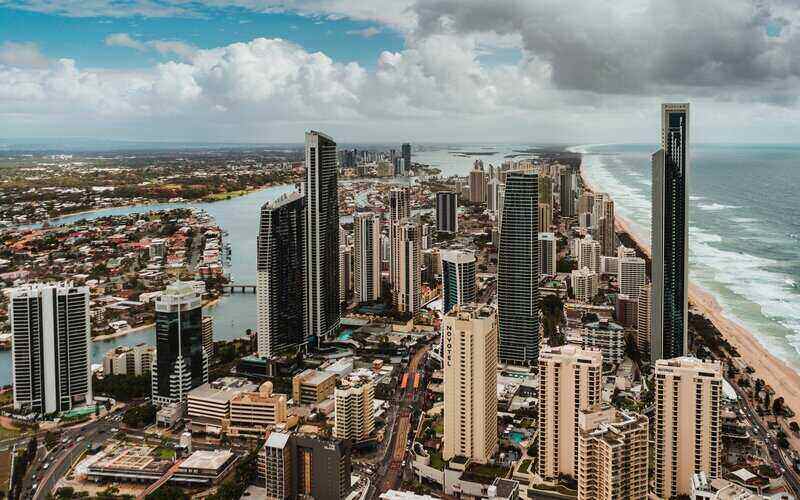
Image by Shinnosuke Ando via Unsplash

Ready, Set, Buy!
Learn everything you need to know about buying property – from choosing the right property and home loan, to the purchasing process, tips to save money and more!
With bonus Q&A sheet and Crossword!


 William Jolly
 Hanan Dervisevic