Bigger home loans and surging house prices saw housing affordability in Australia decline nationally in the December quarter 2020, according to the Real Estate Institute of Australia's (REIA) latest Housing Affordability Report.
The report's measure for housing affordability - the proportion of income required to meet loan repayments - increased nationally by 0.9% to 34.8%.
Mortgage stress is commonly defined as when a household is spending more than 30% of their gross (pre-tax) income on home loan repayments.
Buying a home or looking to refinance? The table below features home loans with some of the lowest interest rates on the market for owner occupiers.
| Lender | Home Loan | Interest Rate | Comparison Rate* | Monthly Repayment | Repayment type | Rate Type | Offset | Redraw | Ongoing Fees | Upfront Fees | Max LVR | Lump Sum Repayment | Additional Repayments | Split Loan Option | Tags | Row Tags | Features | Link | Compare | Promoted Product | Disclosure |
|---|---|---|---|---|---|---|---|---|---|---|---|---|---|---|---|---|---|---|---|---|---|
5.79% p.a. | 5.83% p.a. | $2,931 | Principal & Interest | Variable | $0 | $530 | 90% |
| Promoted | Disclosure | |||||||||||
5.74% p.a. | 5.65% p.a. | $2,915 | Principal & Interest | Variable | $0 | $0 | 80% |
| Promoted | Disclosure | |||||||||||
5.84% p.a. | 6.08% p.a. | $2,947 | Principal & Interest | Variable | $250 | $250 | 60% |
| Promoted | Disclosure |
REIA President Adrian Kelly said the property market has been lifted up by first home buyers racing to take advantage of favourable conditions and enter the market.
"The market defied the doomsday predictions with median house prices rising across the country in 2020 with demand driven mostly from first home buyers," Mr Kelly said.
“Australian first home buyers increased their market share by 50.4% over 2020, motivated by low interest rates and the range of first-home buyer incentives on offer."
The number of first home buyers increased to over 45,000, and they now make up 41.9% of owner occupier dwelling commitments.
“Seeing this trend in conversion to home ownership is particularly great news given the challenges many tenants and investors faced over the pandemic however surging house prices could see housing affordability obliterated unless measures to improve supply are implemented," Mr Kelly said.
"This particularly applies to regional parts of Australia.”
See also: Sydney named third worst city in the world for housing affordability

The proportion of income required to meet average mortgage repayments and median rent payments for a three-bedroom house. Source: REIA Housing Affordability Report.
While housing affordability was better year-on-year by 0.7% nationally, it was worse in New South Wales where the proportion of income required to meet mortgage repayments is now 44.6%, making it the "least affordable state".
Meanwhile, the Northern Territory is now the most affordable with the proportion of income required to meet loan repayments 21.9%.
"It is now more affordable to buy than rent in the Northern Territory,” Mr Kelly said.
See also: Is Australia in a housing bubble?
Rental affordability worsens as regional vacancy rates tighten
The exodus from capital cities to regional areas during COVID-19 has seen rental vacancy rates tighten to as low as 0.1% in some parts, pushing up rental prices as tenants compete for a limited supply of properties.
The report found the proportion of income required to meet rent repayments increased to 24.0% nationally, up 0.4% over the past 12 months.
Rental stress is commonly defined as spending more than 30% of income on rent, though the sweet spot is generally 25%.
See also: How much should you spend on rent?
“Tasmania is now the least affordable state to rent with the proportion of income required to meet rent repayments now a staggering 29.5%, 5.5 percentage points higher than the national level," Mr Kelly said.
“Western Australia is the most affordable, despite the proportion of income required to meet median rents increasing to 17.8%."
It comes as new Domain research revealed competition between tenants will remain fierce as rental vacancy rates remain tight, with the national vacancy rate sitting at 1.9%.
| Rental Vacancy Rates Australia | |||
| Location | Feb-21 | Jan-21 | Feb-20 |
| National | 1.9% | 1.9% | 1.7% |
| Sydney | 2.8% | 2.9% | 2.6% |
| Melbourne | 4.7% | 4.6% | 1.6% |
| Brisbane | 1.4% | 1.6% | 2.1% |
| Perth | 0.7% | 0.7% | 1.8% |
| Adelaide | 0.6% | 0.6% | 0.8% |
| Hobart | 0.5% | 0.4% | 0.6% |
| ACT | 0.8% | 0.9% | 1.0% |
| Darwin | 0.8% | 0.8% | 3.2% |
Source: Domain
Renters in Melbourne and Sydney are likely to have the most luck finding a rental property.
Sydney's vacancy rate rose from 2.6% to 2.8% in February, while Melbourne's vacancy rate surged to 4.7% in February compared with 1.6% the same time last year, as people flee the bigger capital cities.
Domain senior research analyst Dr Nicola Powell said the biggest capital cities are becoming ghost towns.
"In Sydney and Melbourne, the general rule of thumb is that the closer you get to the city, the higher the vacancy rate,” she said.
In the Melbourne CBD, the vacancy rate was a whopping 7.6% in January according to SQM research, while Sydney CBD had a vacancy rate of 5.8%.
Of the remaining capitals, only Brisbane had a vacancy rate above 1%.
"Most of our capital cities remain tight and remain competitive for tenants and what we can expect is rents are going to rise," Dr Powell said.
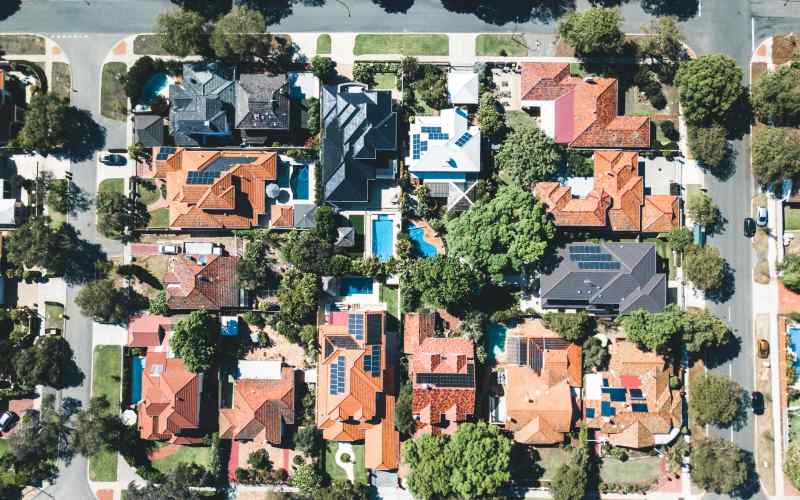
Photo by Arvin Wiyono on Unsplash

Ready, Set, Buy!
Learn everything you need to know about buying property – from choosing the right property and home loan, to the purchasing process, tips to save money and more!
With bonus Q&A sheet and Crossword!


 Emma Duffy
 Harry O'Sullivan