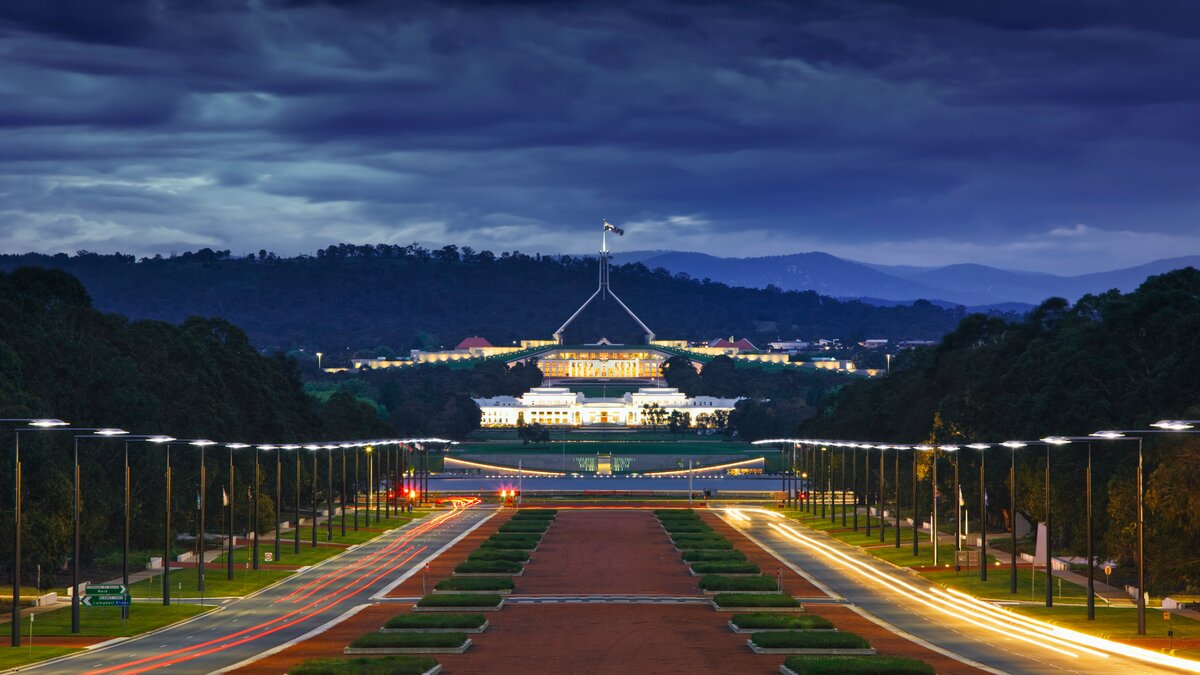
Western Australia can seem a little detached from the rest of the nation. Several thousand kilometres and two time zones separate WA from the east coast cities - as most people have heard at a trivia evening somewhere, Perth is closer to Jakarta than it is to Canberra.
Nevertheless, the post-Covid era has seen Western Australia develop into arguably the hottest property market in the nation. For interstate investors and residents alike, demand for property in Perth and the rest of the state has been booming. From March 2020 to March 2025, Perth dwelling values grew 75.4% according to Cotality (formerly CoreLogic), more than any other capital, while property in Regional Western Australia became nearly 80% more expensive.
If you're considering investing in Western Australia, these are the suburbs the data suggests might have the highest rental yields.
Western Australia rental yields in 2025
Western Australia rental yields are among the strongest in Australia. For both houses and units, regional WA has a higher average yield than anywhere else in the nation. Perth is second to Darwin as the capital with the highest yields for both units and houses.
As of January '25 the average sale price, asking rent and rental yield in WA were as follows:
|
Median price |
Median rent |
Median rental yield |
|
|---|---|---|---|
|
Houses (Perth) |
$780,000 |
$650 |
4.5% |
|
Units (Perth) |
$550,000 |
$620 |
6.2% |
|
Houses (Rest of WA) |
$535,000 |
$620 |
6.6% |
|
Units (Rest of WA) |
$360,000 |
$580 |
8.5% |
Source: Cotality. Data reported to the period ending January 2025. Median values account for sales transactions over three months.
Highest rental yields in Western Australia
Coolgardie, with an average yield of 16.1%, has the highest yields for houses in the nation. For units, Baynton in Karratha took out top spot with a 15.1% average yield.
Western Australia typically dominates the top suburbs in the nation for yields. For example, with a yield of 8% for houses, Karloo ranks 25th in Western Australia. In our equivalent list for the whole country, Narrogin ranks 54th.
The biggest reason for this is mining. Many of these suburbs are in regions like Pilbara, which sits atop one of the world's largest deposits of iron ore. Mining towns tend to have strong rental demand from workers moving temporarily to the area that often doesn't translate to an equivalent demand to buy. Hence the discrepancy between the two and subsequent higher than average yields.
With much more demand to buy, suburbs in and around major cities tend to have lower yields. No Perth suburbs made the top 25 for WA despite having a higher median yield than most of the other capitals.
Houses
| Rank | Suburb (Postcode) | LGA | Median Price | Median Rent | Rental Yield |
|---|---|---|---|---|---|
| 1st | Coolgardie (6429) | Coolgardie | $129,000 | $400 | 16.1% |
| 2nd | Tom Price (6751) | Ashburton | $685,000 | $1,740 | 13.2% |
| 3rd | Kambalda East (6442) | Coolgardie | $150,000 | $360 | 12.5% |
| 4th | Kambalda West (6442) | Coolgardie | $178,500 | $380 | 11.1% |
| 5th | Millars Well (6714) | Karratha | $524,000 | $1,100 | 10.9% |
| 6th | South Boulder (6432) | Kalgoorlie-Boulder | $235,500 | $485 | 10.7% |
| 7th | Port Hedland (6721) | Port Hedland | $739,000 | $1,500 | 10.6% |
| 8th | South Hedland (6722) | Port Hedland | $468,500 | $950 | 10.5% |
| 9th | Nickol (6714) | Karratha | $594,500 | $1,200 | 10.5% |
| 10th | Baynton (6714) | Karratha | $710,000 | $1,400 | 10.3% |
| 11th | Pegs Creek (6714) | Karratha | $510,000 | $1,000 | 10.2% |
| 12th | Newman (6753) | East Pilbara | $333,500 | $650 | 10.1% |
| 13th | Boulder (6432) | Kalgoorlie-Boulder | $289,000 | $550 | 9.9% |
| 14th | Bulgarra (6714) | Karratha | $520,000 | $950 | 9.5% |
| 15th | Kalgoorlie (6430) | Kalgoorlie-Boulder | $332,750 | $600 | 9.4% |
| 16th | Merredin (6415) | Merredin | $215,000 | $380 | 9.2% |
| 17th | Derby (6728) | Derby-West Kimberley | $245,000 | $430 | 9.1% |
| 18th | Djugun (6725) | Broome | $710,000 | $1,200 | 8.8% |
| 19th | Ravensthorpe (6346) | Ravensthorpe | $220,000 | $370 | 8.7% |
| 20th | Piccadilly (6430) | Kalgoorlie-Boulder | $389,500 | $650 | 8.7% |
| 21st | West Lamington (6430) | Kalgoorlie-Boulder | $394,500 | $650 | 8.6% |
| 22nd | South Kalgoorlie (6430) | Kalgoorlie-Boulder | $370,000 | $595 | 8.4% |
| 23rd | Lamington (6430) | Kalgoorlie-Boulder | $412,500 | $650 | 8.2% |
| 24th | Katanning (6317) | Katanning | $261,250 | $410 | 8.2% |
| 25th | Karloo (6530) | Greater Geraldton | $278,000 | $430 | 8.0% |
Source: Cotality. Data reported to the period ending January 2025. Median values account for sales transactions over 12 months.
Units
| Rank | Suburb (Postcode) | LGA | Median Price | Median Rent | Rental Yield |
|---|---|---|---|---|---|
| 1st | Baynton (6714) | Karratha | $515,000 | $1,325 | 13.4% |
| 2nd | South Hedland (6722) | Port Hedland | $290,000 | $700 | 12.6% |
| 3rd | Pegs Creek (6714) | Karratha | $410,000 | $975 | 12.4% |
| 4th | Cable Beach (6726) | Broome | $330,000 | $750 | 11.8% |
| 5th | Port Hedland (6721) | Port Hedland | $378,561 | $800 | 11.0% |
| 6th | Broome (6725) | Broome | $332,500 | $700 | 10.9% |
| 7th | Bulgarra (6714) | Karratha | $293,500 | $615 | 10.9% |
| 8th | Somerville (6430) | Kalgoorlie-Boulder | $287,500 | $600 | 10.9% |
| 9th | Boulder (6432) | Kalgoorlie-Boulder | $230,000 | $475 | 10.7% |
| 10th | Newman (6753) | East Pilbara | $225,000 | $450 | 10.4% |
| 11th | Piccadilly (6430) | Kalgoorlie-Boulder | $282,500 | $500 | 9.2% |
| 12th | Beresford (6530) | Greater Geraldton | $255,000 | $450 | 9.2% |
| 13th | Kalgoorlie (6430) | Kalgoorlie-Boulder | $300,000 | $520 | 9.0% |
| 14th | Djugun (6725) | Broome | $429,500 | $700 | 8.5% |
| 15th | Derby (6728) | Derby-West Kimberley | $240,000 | $390 | 8.5% |
| 16th | Bilingurr (6725) | Broome | $412,000 | $650 | 8.2% |
| 17th | Northam (6401) | Northam | $210,000 | $325 | 8.0% |
| 18th | Withers (6230) | Bunbury | $240,000 | $370 | 8.0% |
| 19th | Kununurra (6743) | Wyndham-East Kimberley | $360,000 | $537.5 | 7.8% |
| 20th | Thornlie (6108) | Gosnells | $381,500 | $550 | 7.5% |
| 21st | Bayswater (6053) | Bayswater | $418,000 | $600 | 7.5% |
| 22nd | South Kalgoorlie (6430) | Kalgoorlie-Boulder | $350,000 | $500 | 7.4% |
| 23rd | Erskine (6210) | Mandurah | $367,500 | $520 | 7.4% |
| 24th | Glendalough (6016) | Stirling | $390,000 | $550 | 7.3% |
| 25th | Perth (6000) | Perth | $490,000 | $678 | 7.2% |
Source: Cotality. Data reported to the period ending January 2025. Median values account for sales transactions over 12 months.
Highest rental yields in Perth
The suburb with the highest yields for houses in the Perth statistical division as of January was Midvale in Swan, at 6.1%. For units it was Thornlie at 7.5%.
Houses
| Rank | Suburb (Postcode) | LGA | Median Price | Median Rent | Rental Yield |
|---|---|---|---|---|---|
| 1st | Midvale (6056) | Swan | $550,000 | $650 | 6.1% |
| 2nd | Cannington (6107) | Canning | $589,000 | $680 | 6.0% |
| 3rd | Brookdale (6112) | Armadale | $550,000 | $600 | 5.7% |
| 4th | Brabham (6055) | Swan | $680,000 | $730 | 5.6% |
| 5th | Bellevue (6056) | Swan | $568,500 | $600 | 5.5% |
| 6th | Midland (6056) | Swan | $530,000 | $558 | 5.5% |
| 7th | Dayton (6055) | Swan | $675,000 | $710 | 5.5% |
| 8th | Hilbert (6112) | Armadale | $620,000 | $650 | 5.5% |
| 9th | Armadale (6112) | Armadale | $545,000 | $570 | 5.4% |
| 10th | Lockridge (6054) | Swan | $567,500 | $585 | 5.4% |
| 11th | Bullsbrook (6084) | Swan | $660,000 | $680 | 5.4% |
| 12th | Lynwood (6147) | Canning | $675,000 | $695 | 5.4% |
| 13th | Bennett Springs (6063) | Swan | $730,000 | $750 | 5.3% |
| 14th | East Cannington (6107) | Canning | $682,500 | $700 | 5.3% |
| 15th | Middle Swan (6056) | Swan | $585,000 | $600 | 5.3% |
| 16th | Maddington (6109) | Gosnells | $610,000 | $625 | 5.3% |
| 17th | Banksia Grove (6031) | Wanneroo | $650,000 | $665 | 5.3% |
| 18th | Kiara (6054) | Swan | $685,000 | $700 | 5.3% |
| 19th | Sinagra (6065) | Wanneroo | $705,000 | $720 | 5.3% |
| 20th | Koondoola (6064) | Wanneroo | $572,000 | $580 | 5.3% |
| 21st | Langford (6147) | Gosnells | $625,000 | $633 | 5.3% |
| 22nd | Kelmscott (6111) | Armadale | $588,000 | $595 | 5.3% |
| 23rd | Ellenbrook (6069) | Swan | $654,000 | $660 | 5.2% |
| 24th | Camillo (6111) | Armadale | $575,000 | $580 | 5.2% |
| 25th | Beckenham (6107) | Gosnells | $670,000 | $675 | 5.2% |
Source: Cotality. Data reported to the period ending January 2025. Median values account for sales transactions over 12 months.
Units
| Rank | Suburb (Postcode) | LGA | Median Price | Median Rent | Rental Yield |
|---|---|---|---|---|---|
| 1st | Thornlie (6108) | Gosnells | $381,500 | $550 | 7.5% |
| 2nd | Bayswater (6053) | Bayswater | $418,000 | $600 | 7.5% |
| 3rd | Glendalough (6016) | Stirling | $390,000 | $550 | 7.3% |
| 4th | Perth (6000) | Perth | $490,000 | $678 | 7.2% |
| 5th | Orelia (6167) | Kwinana | $306,000 | $420 | 7.1% |
| 6th | Lockridge (6054) | Swan | $435,000 | $595 | 7.1% |
| 7th | Wembley (6014) | Cambridge | $385,000 | $525 | 7.1% |
| 8th | East Perth (6004) | Perth | $515,000 | $700 | 7.1% |
| 9th | Northbridge (6003) | Perth | $505,000 | $675 | 7.0% |
| 10th | Sorrento (6020) | Joondalup | $500,000 | $668 | 6.9% |
| 11th | Redcliffe (6104) | Belmont | $450,000 | $600 | 6.9% |
| 12th | East Cannington (6107) | Canning | $450,000 | $600 | 6.9% |
| 13th | Victoria Park (6100) | Victoria Park | $450,000 | $595 | 6.9% |
| 14th | East Victoria Park (6101) | Victoria Park | $495,250 | $650 | 6.8% |
| 15th | Beckenham (6107) | Gosnells | $430,000 | $560 | 6.8% |
| 16th | Cloverdale (6105) | Belmont | $465,000 | $600 | 6.7% |
| 17th | Burswood (6100) | Victoria Park | $566,500 | $730 | 6.7% |
| 18th | Wembley Downs (6019) | Stirling | $507,500 | $650 | 6.7% |
| 19th | Woodvale (6026) | Joondalup | $490,000 | $628 | 6.7% |
| 20th | Kenwick (6107) | Gosnells | $484,400 | $620 | 6.7% |
| 21st | Currambine (6028) | Joondalup | $455,000 | $580 | 6.6% |
| 22nd | Rivervale (6103) | Belmont | $495,000 | $630 | 6.6% |
| 23rd | West Perth (6005) | Perth | $531,000 | $675 | 6.6% |
| 24th | Ellenbrook (6069) | Swan | $433,000 | $550 | 6.6% |
| 25th | Clarkson (6030) | Wanneroo | $435,000 | $550 | 6.6% |
Source: Cotality. Data reported to the period ending January 2025. Median values account for sales transactions over 12 months.
Looking for an investment property? Here are some of the top investment home loans available on the Australian market right now
| Lender | Home Loan | Interest Rate | Comparison Rate* | Monthly Repayment | Repayment type | Rate Type | Offset | Redraw | Ongoing Fees | Upfront Fees | Max LVR | Lump Sum Repayment | Extra Repayments | Split Loan Option | Tags | Features | Link | Compare | Promoted Product | Disclosure |
|---|---|---|---|---|---|---|---|---|---|---|---|---|---|---|---|---|---|---|---|---|
5.69% p.a. | 6.03% p.a. | $2,899 | Principal & Interest | Variable | $0 | $530 | 90% |
| Disclosure | |||||||||||
5.74% p.a. | 5.76% p.a. | $2,915 | Principal & Interest | Variable | $0 | $250 | 60% | Disclosure | ||||||||||||
5.69% p.a. | 5.60% p.a. | $2,899 | Principal & Interest | Variable | $0 | $0 | 80% |
| Promoted | Disclosure | ||||||||||
5.84% p.a. | 5.88% p.a. | $2,947 | Principal & Interest | Variable | $0 | $530 | 90% |
| Promoted | Disclosure | ||||||||||
5.74% p.a. | 5.76% p.a. | $2,915 | Principal & Interest | Variable | $0 | $350 | 60% |

")


First published on May 2024
Picture by Nathan Hurst on Unsplash
Ready, Set, Buy!
Learn everything you need to know about buying property – from choosing the right property and home loan, to the purchasing process, tips to save money and more!
With bonus Q&A sheet and Crossword!

 Harrison Astbury
 Rachel Horan