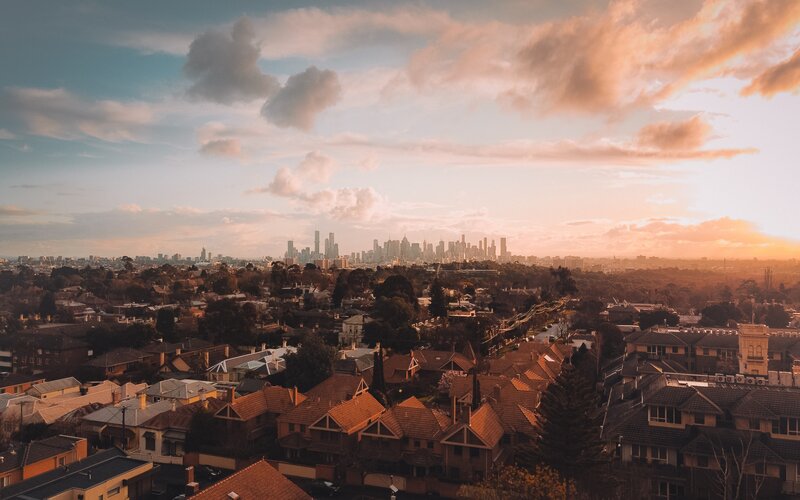
Exclusive data from CoreLogic revealed the top three suburbs in each capital city with the highest 10-year average annual growth.
The best performing suburb over the past decade was in Hobart - Primrose Sands - where house prices increased by an average of 12.1% each year.
The median house price in Primrose Sands is currently $555,742. This is up from $177,153 the decade prior, which means that house prices have more than tripled over the past 10 years.
Coming in second place was Sydney suburb Colebee where house prices increased, on average, 11.9% yearly over the past 10-years.
The median house value in this suburb a decade ago was $397,698, while the median house value is now $1,221,513.
Tying for third place were another two Sydney suburbs - Allambie Heights and Ettalong Beach - which both saw house prices increase an average of 11.4% year-on-year over the past decade.
Allambie Height's median house is currently $2,609,705 - up from $883,422.
In Ettalong Beach, median house prices have risen from $391,880 to $1,154,933 over the past decade.
Check out the top three performing suburbs for each capital city in the table below.
Australian capital city suburb growth over the past decade
|
Suburb |
Average annual growth over 10 years |
Median house value - February 2022 |
Indexed median house value - February 2012 |
|
Sydney |
|
|
|
|
Colebee |
11.9% |
$1,221,513 |
$397,698 |
|
Allambie Heights |
11.4% |
$2,609,705 |
$883,422 |
|
Ettalong Beach |
11.4% |
$1,545,933 |
$391,880 |
|
Melbourne |
|
|
|
|
St Andrews Beach |
10% |
$1,742,714 |
$670,965 |
|
Kalkallo |
9.5% |
$696,540 |
$279,961 |
|
Dromana |
9.4% |
$1,145,562 |
$465,620 |
|
Brisbane |
|
|
|
|
Stafford Heights |
8.5% |
$1,002,652 |
$443,996 |
|
Robertson |
8.3% |
$1,542,959 |
$697,584 |
|
Tarragindi |
8.2% |
$1,293,104 |
$587,231 |
|
Adelaide |
|
|
|
|
Goodwood |
9.1% |
$1,428,098 |
$600,325 |
|
Fullarton |
7.9% |
$1,462,228 |
$684,608 |
|
Nailsworth |
7.8% |
$1,103,041 |
$518,440 |
|
Canberra |
|
|
|
|
Pearce |
9.5% |
$1,383,134 |
$560,551 |
|
Garran |
8.9% |
$1,711,864 |
$732,449 |
|
Chifley |
8.5% |
$1,207,047 |
$535,518 |
|
Hobart |
|
|
|
|
Primrose Sands |
12.1% |
$555,742 |
$177,153 |
|
Bridgewater |
10.2% |
$492,089 |
$185,767 |
|
North Hobart |
9.5% |
$1,105,973 |
$444,660 |
|
Perth |
|
|
|
|
Treeby |
3.7% |
$621,552 |
$430,514 |
|
Willetton |
3.4% |
$854,627 |
$612,567 |
|
Daglish |
3.2% |
$1,732,909 |
$1,261,321 |
|
Darwin |
|
|
|
|
Zuccoli |
7.4% |
$515,991 |
$251,777 |
|
Bellamack |
5.1% |
$568,945 |
$347,190 |
|
Rapid Creek |
4% |
$788,474 |
$532,779 |
Source: CoreLogic
Article originally published by Alex Brewster on 5 March 2020, updated by Rachel Horan on 1 March 2022

Ready, Set, Buy!
Learn everything you need to know about buying property – from choosing the right property and home loan, to the purchasing process, tips to save money and more!
With bonus Q&A sheet and Crossword!


 Denise Raward


 Brooke Cooper
 Harrison Astbury