The latest Rental Affordability Index (RAI), published by National Shelter, SGS Economics & Planning, the Brotherhood of St Laurence, and Beyond Bank Australia, revealed every capital city around the nation experienced a decline in rental affordability in 2022.
Hobart continues to be the most unaffordable city for renters in Australia with an RAI score of 102.
Meanwhile, Greater Brisbane has hit a historic low point for affordability, recording an 11% decrease in its RAI score over the past year - the largest decline of any capital city.
This year’s RAI findings show rents are escalating faster than incomes across the country, with low vacancy rates, interstate migration, and global supply chain issues contributing to increased rents.
RAI scores relate to the severity of housing affordability, and scores of 100 and less indicate that households spend 30% or more of their income on rent.
Under those circumstances, the cost of renting affects a household’s ability to pay for other primary needs such as food, power, medicine, and transport.
National Shelter CEO Emma Greenhalgh said housing stress and homelessness is increasing across the nation due to a lack of affordable housing options.
“Rental increases mean individuals and families are forced to move away from family and friends driving disconnection at the same time they are struggling to find money to pay for essentials like food, utilities, and healthcare,” Ms Greenhalgh said.
“Low-income renters need more active intervention. We need rental reform that includes limiting rent increases and adjustments to income support including Commonwealth Rent Assistance.
“While it’s promising to see plans like the Housing Australia Future Fund, the National Housing Accord and the development of a National Homelessness Plan, more has to be done to support the health and wellbeing of communities, and low-income earners doing it particularly tough.”
The study revealed that while many different demographics found the current situation unaffordable, singles on a JobSeeker payment and singles on the age pension were worse off, with these groups finding the rental prices 'severely to extremely' unaffordable.
It was found that the only household with 'affordable to very affordable' rental options are dual income couples with children.
How does each state fare in rental affordability?
Despite the increased number of renting households (26% in 1995 to 31% in 2020), the number of public housing tenants halved over the same period (from 5.5% to 2.9%).
On average, people are spending 20% of their income on rent, while owners with a mortgage pay 15.5%.
| Region | RAI | Share of income spent on rent | Relative unaffordability |
| Greater Sydney | 120 | 25% | Moderately unaffordable rents |
| Greater Melbourne | 140 | 21% | Acceptable rents |
| Greater Brisbane | 113 | 27% | Moderately unaffordable rents |
| Greater Adelaide | 119 | 25% | Moderately unaffordable rents |
| Greater Perth | 124 | 24% | Acceptable rents |
| Greater Hobart | 102 | 29% | Unaffordable rents |
| ACT | 121 | 25% | Acceptable rents |
Additionally, regional rental affordability has been shown in the table below - affordability has been hit harder in regional areas than metropolitan areas.
| Region | RAI | Share of income spent on rent | Relative unaffordability |
| Rest of NSW | 106 | 28% | Moderately unaffordable rents |
| Rest of VIC | 115 | 26% | Moderately unaffordable rents |
| Rest of QLD | 104 | 29% | Moderately unaffordable rents |
| Rest of SA | 137 | 22% | Acceptable rents |
| Rest of WA | 134 | 22% | Acceptable rents |
| Rest of TAS | 108 | 28% | Moderately unaffordable rents |
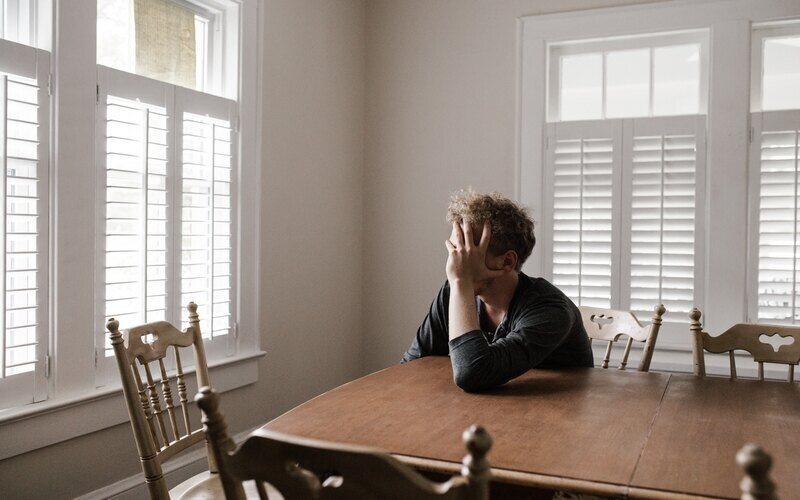
Image by Jaye Haych via Unsplash

Ready, Set, Buy!
Learn everything you need to know about buying property – from choosing the right property and home loan, to the purchasing process, tips to save money and more!
With bonus Q&A sheet and Crossword!


 Denise Raward

 Harry O'Sullivan
 Harrison Astbury


