According to the CoreLogic Home Value Index (HVI), the median house price in Sydney is $1.193 million as of the end of October.
This is down 0.1% from September, the first time price growth in Sydney has been negative since prices started to climb nearly two years ago.
Prices also went down for both houses and units in Melbourne, Darwin and Canberra, while the pace of growth eased in Brisbane, Perth and Adelaide.
CoreLogic Research Director Tim Lawless says price growth on more expensive, premium properties has been weakening across the nation, while the more affordable end of the market is still performing.
"A combination of less borrowing capacity and broader affordability challenges, as well as a higher than average share of investors and first home buyers in the market is the most likely explanation for stronger conditions across the lower value cohorts of the market," he explained.
The national median dwelling price still gained 0.3% through the month, reaching another new nominal high of $810,000.
Stock back on the market?
After property prices across Australia fell dramatically during the second half of 2022, there weren't many commentators in January last year that were predicting 18-odd months of continued growth.
Many analysts believe persistently low supply has been the biggest driver of the surprise boost.
Listing levels have consistently been well below long term averages throughout the nation, creating a sellers' market in many of the capitals.
Now that prices are elevated though, property owners are seemingly becoming more open to selling up.
Since the end of winter, advertised inventory levels in the capital cities have risen 12.7% based on a rolling four week count of listings to 27 October.
The two largest markets in particular are seeing a surge in sellers, with listings in Sydney now 13.2% above the previous five year average while Melbourne is 13% higher.
In Perth, Brisbane and Adelaide, where supply levels have been exceptionally low (and also the cities that have seen property prices rise the most), Mr Lawless says the "balance" between sellers and buyers is starting to improve.
"Mid sized capitals are still leading the pace of value growth [but] these markets are also losing momentum," he said.
Auction market the coalface of property momentum
For Sydney, auction levels are elevated yet clearance rates are down. Last weekend saw nearly 1,000 properties go under the hammer, with just a 64.5% clearance rate.
This is the second-lowest clearance rate so far in 2024, with the first weekend of October the lowest (62.77%), with footy finals thought to have distracted property buyers.
With ongoing high volumes and not having the demand to match, anything below 60% could demonstrate emerging weakness in Sydney as affordability ceilings are reached.
SQM Research has the Sydney auction market weaker still with just a 41.3% clearance rate last weekend. SQM's research methodology is different to CoreLogic's.
Further headwinds noted
Meanwhile, another report suggests involuntary listings could be set to rise over the coming twelve months.
Moody's Credit Ratings found that mortgage delinquency rates rose in every state over the year to May, increasing in both capital cities and regions.
Letitia Wong, Analyst at Moody’s expects delinquency rates to continue to rise, even if the RBA cut rates.
"Rate cuts over the next year will ease the burden on borrowers," Ms Wong said.
"However, it will take time for stretched household finances to recover from the strain of high interest rates over the past few years. Also, while inflation is easing, cost-of-living pressures persist."
Economists from all of the big four banks now don't expect rate cuts until February next year at the earliest.
While it feels slightly macabre to talk about an increase in listings because of people defaulting on their home loan, this could also contribute to price growth easing further.
Advertisement
Looking to buy? Below are some of the strongest owner occupier home loan rates available at the biggest Australian lenders
| Lender | Home Loan | Interest Rate | Comparison Rate* | Monthly Repayment | Repayment type | Rate Type | Offset | Redraw | Ongoing Fees | Upfront Fees | Max LVR | Lump Sum Repayment | Additional Repayments | Split Loan Option | Tags | Row Tags | Features | Link | Compare | Promoted Product | Disclosure |
|---|---|---|---|---|---|---|---|---|---|---|---|---|---|---|---|---|---|---|---|---|---|
5.59% p.a. | 5.59% p.a. | $2,867 | Principal & Interest | Variable | $0 | $0 | 80% | ||||||||||||||
5.89% p.a. | 6.02% p.a. | $2,962 | Principal & Interest | Variable | $10 | $220 | 80% | ||||||||||||||
5.89% p.a. | 6.14% p.a. | $2,962 | Principal & Interest | Variable | $248 | $350 | 70% | ||||||||||||||
6.04% p.a. | 6.07% p.a. | $3,011 | Principal & Interest | Variable | $0 | $350 | 80% | ||||||||||||||
5.88% p.a. | 6.01% p.a. | $2,959 | Principal & Interest | Variable | $10 | $450 | 70% | ||||||||||||||
6.19% p.a. | 6.20% p.a. | $3,059 | Principal & Interest | Variable | $0 | $0 | 97% | ||||||||||||||
6.19% p.a. | 6.19% p.a. | $3,059 | Principal & Interest | Variable | $0 | $160 | 70% | ||||||||||||||
6.54% p.a. | 6.63% p.a. | $3,174 | Principal & Interest | Variable | $8 | $350 | 80% | ||||||||||||||
6.54% p.a. | 6.92% p.a. | $3,174 | Principal & Interest | Variable | $0 | $0 | 90% |
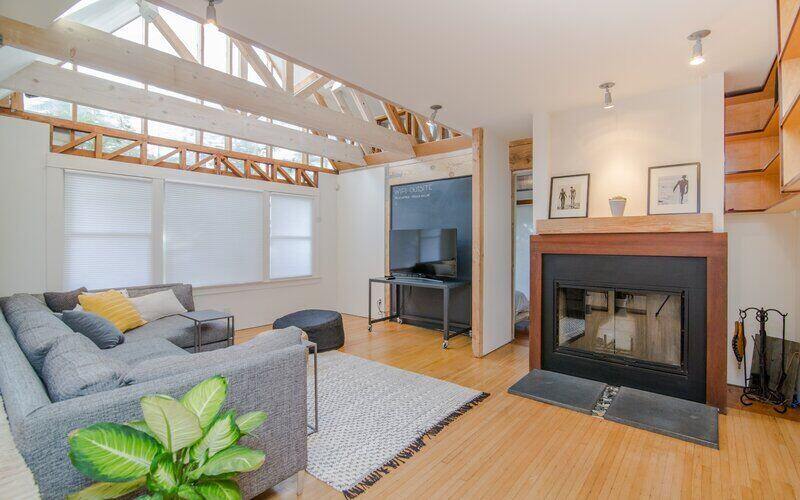
Image by Belle Co via Pexels

Ready, Set, Buy!
Learn everything you need to know about buying property – from choosing the right property and home loan, to the purchasing process, tips to save money and more!
With bonus Q&A sheet and Crossword!











 Harry O'Sullivan


 Denise Raward
 Rachel Horan