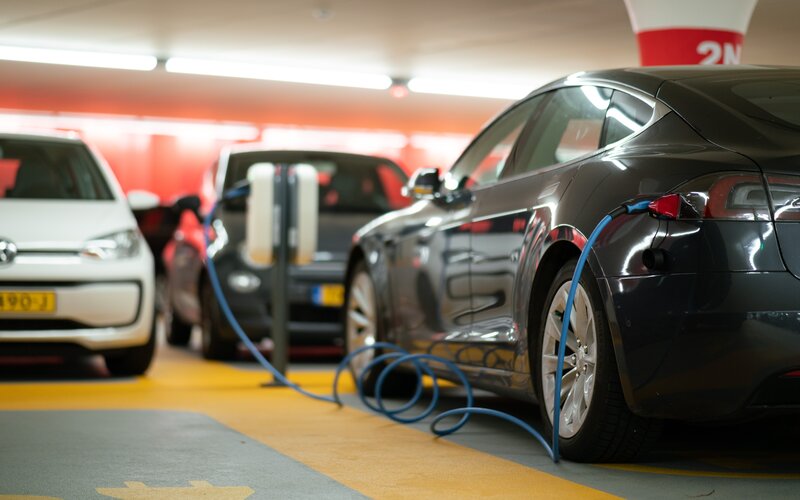
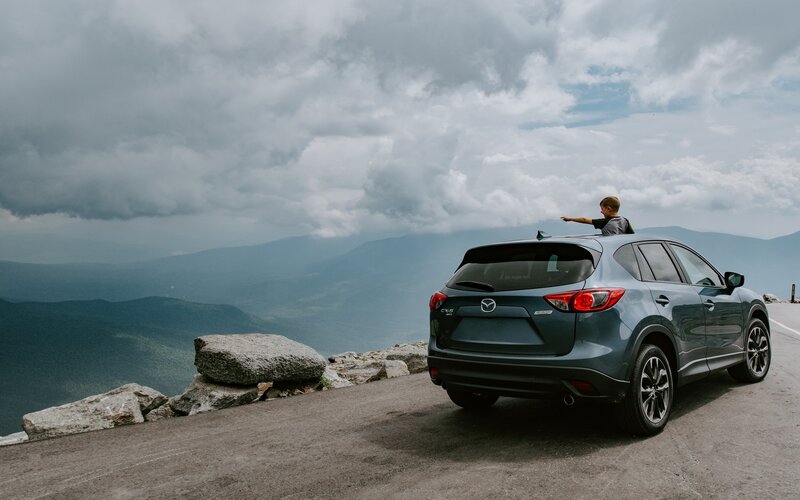
The Federal Chamber of Automotive Industries (FCAI) reported there were 92,347 new vehicle sales in April compared to 38,926 sales in the same period last year.
Last year's figure was heavily affected by the pandemic, but the FCAI noted last month's result was also 22% higher than April 2019 when 75,550 vehicles were sold.
In the market for a new car? The table below features car loans with some of the lowest interest rates on the market.
Lender Car Loan Interest Rate Comparison Rate* Monthly Repayment Interest Type Vehicle Type Maximum Vehicle Age Ongoing Fee Upfront Fee Total Repayment Early Repayment Instant Approval Online Application Tags Row Tags Features Link Compare Promoted Product Disclosure
Promoted
Disclosure
Promoted
Disclosure
Promoted
Disclosure
Year to date, sales were up 30.7% compared to 2020, with 355,995 sales this year compared with 272,287 in 2020 with growth recorded in all segments.
FCAI chief executive, Tony Weber, said he expected the strong growth in sales to continue as the year progressed.
“New vehicles sales are a direct reflection of the performance of the broader economy in terms of consumer and business confidence,” Mr Weber said.
“This time last year we were seeing significant impacts from COVID-19 with less customer activity and inquiries to dealerships.
“Historically the April result is between 70,000 and 80,000 vehicles, so the 2021 result is very significant.
"This sales trend is expected to continue as we enter the final two months of the financial year.
The Sports Utility vehicle market saw the strongest growth in April, up by 31,154 new sales (172.9%), followed by the Light Commercial Market (172.9%), and the Passenger Vehicle market (97.2%).
Toyota was the market leader (20,208) followed by Mazda (10,052), Mitsubishi (7,513), Ford (7,146) and Hyundai (5,772).
Ford Ranger was the top-selling individual model (5,021) followed by the Toyota RAV4 (4506), Toyota Hi-Lux (4222), Toyota Landcruiser (3,177) and Mitsubishi Triton (2,458).
Suez Canal blockage causes supply issues
Mr Weber noted there had been difficulties in getting new vehicles to Australia as a result of the Ever Given cargo ship blocking the Suez Canal in Egypt.
“Every vehicle company is focused on solving the issues caused by these impacts and they are working with customers to keep them fully informed regarding supply issues and delivery dates.
"It is possible there is pent-up market demand which may be reflected in sales figures in the second half of 2021 as solutions are found to these issues."
Solution to every problem#suezcanal #SuezCrisis pic.twitter.com/ZMAEP3t9vT
— sani (@saniartboard) March 28, 2021
He added there had been an increase in sales for rental vehicles across all segments, in what would be welcome news for the suffering tourism industry.
"Growth in rental fleets will be an important building block supporting the recovery of the tourism industry across the country," Mr Weber said.
Photo by Kyle Grozelle on Unsplash

















 Denise Raward
 Harry O'Sullivan

 Jacob Cocciolone
