Despite an easing in the quarterly rate of growth in the second half of 2021, national construction costs had the highest annual growth rate since March 2005.
Over the three months to September 2021, construction costs surged 3.8% but then softened to 1.1% in the December quarter.
This most recent result brought the quarterly trend back in line with the five-year average of 1.3%, which is also below the Consumer Price Index (CPI) for the same period.
Rising construction costs are in lieu of property price growth at 22.4% through the year.
CoreLogic Research Director Tim Lawless said growth in residential construction costs is still expected to remain 'above average' over the coming quarter due to supply chain disruptions.
"There is a significant amount of residential construction work in the pipeline that has been approved but not yet completed," Mr Lawless said.
"With some materials such as timber and metal products reportedly remaining in short supply, there is the possibility some residential projects will be delayed or run over budget."
The median price of land also increased by 12.6% over the year to September 2021, with a recent report from HIA-CoreLogic pointing out that the 'significant' increase in the price of land indicates supply isn't keeping up with demand.
"With such a large rise in construction costs over the year, we could see this translating into more expensive new homes and bigger renovation costs, ultimately placing additional upwards pressure on inflation," Mr Lawless said.
CoreLogic Head of Insurance Solutions Matthew Walker said rising construction costs don't just impact renovators, builders and businesses, but all homeowners and property investors.
"In these times of rapidly rising home and construction costs, under insurance can quickly become a real threat to what is a most valuable asset," Mr Walker said.
"It’s important that home owners keep track of their sum insured and annually check that it is sufficient should the worst occur by using their insurer’s rebuild calculator or giving them a call."
Advertisement
Building a home? This table below features construction loans with some of the lowest interest rates on the market.
| Lender | Home Loan | Interest Rate | Comparison Rate* | Monthly Repayment | Repayment type | Rate Type | Offset | Redraw | Ongoing Fees | Upfront Fees | Max LVR | Lump Sum Repayment | Additional Repayments | Split Loan Option | Tags | Row Tags | Features | Link | Compare | Promoted Product | Disclosure |
|---|---|---|---|---|---|---|---|---|---|---|---|---|---|---|---|---|---|---|---|---|---|
6.18% p.a. | 6.44% p.a. | $2,575 | Interest-only | Variable | $0 | $530 | 90% |
| Promoted | Disclosure | |||||||||||
6.19% p.a. | 6.25% p.a. | $2,579 | Interest-only | Variable | $0 | $835 | 90% | ||||||||||||||
6.39% p.a. | 6.78% p.a. | $2,663 | Interest-only | Variable | $null | $721 | 90% | ||||||||||||||
6.53% p.a. | 6.56% p.a. | $2,721 | Interest-only | Variable | $0 | $450 | 80% | ||||||||||||||
6.69% p.a. | 6.66% p.a. | $2,788 | Interest-only | Variable | $0 | $530 | 90% | ||||||||||||||
6.99% p.a. | 7.76% p.a. | $2,913 | Interest-only | Variable | $20 | $644 | 90% | ||||||||||||||
8.14% p.a. | 8.47% p.a. | $3,718 | Principal & Interest | Variable | $0 | $0 | 75% | ||||||||||||||
8.45% p.a. | 7.53% p.a. | $3,521 | Interest-only | Variable | $0 | $1,212 | 90% | ||||||||||||||
8.43% p.a. | 8.50% p.a. | $3,820 | Principal & Interest | Variable | $0 | $900 | 80% | ||||||||||||||
6.19% p.a. | 6.61% p.a. | $3,059 | Principal & Interest | Variable | $395 | $null | 95% |
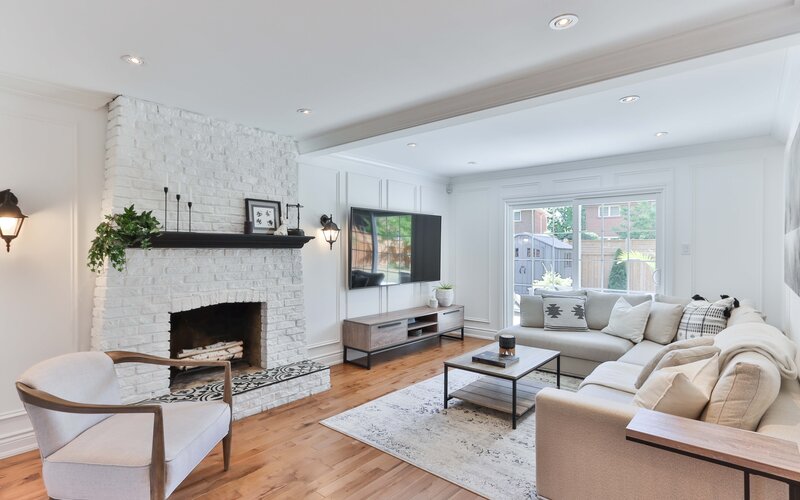
Image by Greyson Joralemon on Unsplash

Ready, Set, Buy!
Learn everything you need to know about buying property – from choosing the right property and home loan, to the purchasing process, tips to save money and more!
With bonus Q&A sheet and Crossword!


 Denise Raward
 Harrison Astbury
 Harry O'Sullivan
 Rachel Horan


