Median house prices in Brisbane shot up by 28.2% from the March 2020 quarter to the March 2022 quarter, while the Gold Coast Metro saw prices increase 16.8% according to PRD's latest Affordable & Liveable Property Guide.
But while these cities are only an hour's drive apart, their property markets are very different.
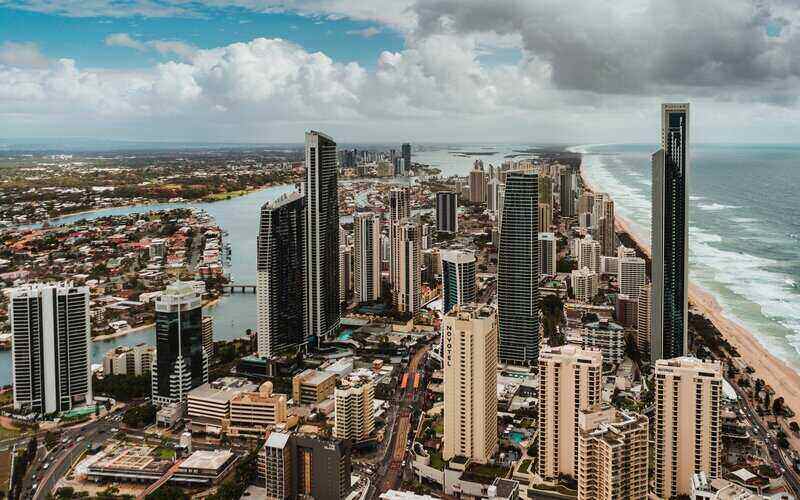
One is a bustling city littered with high-rise building and bridges, and another is a seaside hotspot for tourists and beach lovers alike.
Brisbane's 'buzzing' property market: Will it keep bringing home the honey?
The median house price in Brisbane is now $950,000, and the median unit price is now $489,000 - a 5.8% increase over the past two years.
Total sales declined 16.1% for houses over the past year for houses and 2.6% for units, but during this time, property prices kept climbing.
Brisbane Metro is still seeing price growth at a higher rate than in the past six months, in contrast to many other Metro areas, driven by the undersupply for houses.
While property price growth has started to slow down in Sydney and Melbourne, Brisbane property prices continue to shoot up.
Propertyology's Head of Research Simon Pressley predicted that Brisbane house prices would rise by up to 20% this year due to 15 years of suppressed real estate activity.
According to PRD, there's a total of $1.9 billion in mixed-use and residential projects planned for the first half of this year.
The announcement of Brisbane hosting the 2032 Olympics, as well as international borders reopening, is set to see Brisbane continue to be a popular spot for property investors.

Source: PRD Real Estate
Brisbane's top suburb performers in 2021/22
PRD collected a list of Brisbane suburbs - from inner city to the east - that have performed over the past year.
| Suburb | Type | Median price 2020 | Median price 2021/22 | Price growth |
| Teneriffe | House | $1,925,000 | $2,650,000 | 37.7% |
| Bowen Hills | Unit | $441,480 | $450,000 | 2% |
| Geebung | House | $606,500 | $790,000 | 30.3% |
| Geebung | Unit | $365,000 | $525,000 | 43.8% |
| Rochedale | House | $1,050,000 | $1,290,000 | 22.9% |
| Rochedale | Unit | $587,000 | $700,000 | 19.3% |
| Lota | House | $690,000 | $892,500 | 29.3% |
| Wynnum West | Unit | $345,000 | $420,000 | 21.7% |
| Taringa | House | $1,005,000 | $1,457,500 | 45% |
| Forest Lake | Unit | $269,000 | $342,000 | 27.3% |
Source: PRD Real Estate
House rent prices increased 13.4% in the March quarter 2022
House rental yields in Brisbane Metro were 3.3% in the first quarter of this year, and over the past year median house rental prices increased by 13.4% to $550 per week.
Average days on market is also at a low 19 days.
The house rental market is still showing strong growth, with three bedroom houses recording the highest annual rental growth of 10.2% to $485 per week.
At the same time, Brisbane Metro recorded a low vacancy rate of 0.7% over the past quarter, well below the Real Estate Institute of Australia (REIA)'s healthy benchmark of 3%.
Brisbane's vacancy rate has been declining since April 2020, and combined with median rental price growth this creates a "confident" investment environment.
Which Brisbane suburbs are still affordable and liveable?
If you're looking to buy a home in Queensland's capital, PRD named six Brisbane suburbs you might want to put on your radar:
- Tingalpa
- Geebung
- Lota
- Warner
- Nundah
- Birkdale
The first three suburbs are for house markets while the latter three are for unit markets.
1. Tingalpa suburb profile
Tingalpa is located 9kms from Brisbane's CBD, boasting a median house price of $735,981 - below Brisbane's current median house price of $950,000.
Annual median price growth was 22.8%*; the rental vacancy rate is currently 0.2%; rental yield is currently 3.6%; $11.5 million in projects are underway; and the unemployment rate is 3.3%.
2. Geebung suburb profile
While Geebung is slightly further out at 10kms from the city, its median house price is slightly higher at $790,000.
Annual median price growth was 30.3%*; the vacancy rate is currently 0.6%; rental yield is currently 3.6%; $21.2 million in total projects; and the unemployment rate is 3.8%.
3. Lota suburb profile
Lota's located 15kms from Brisbane with a median house price of $892,500.
Annual median price growth was 29.3%*; the vacancy rate is currently 0.5%; rental yield is 3.5%; $30 million in total projects; and the unemployment rate is 4.5%.
4. Warner suburb profile
Warner is a bit further out at 16kms from the CBD, with a median unit price of $361,250.
Annual median price growth for units was 32.6%*; the vacancy rate is 0.2%; rental yield is 5.4%; $4.2 million in total projects; and the unemployment rate is 3.8%.
5. Nundah suburb profile
Nundah is a bit closer at 7kms from the city with a median unit price of $431,250.
Annual median price growth was 10.6%*; the vacancy rate is 0.3%; rental yield is 5.2%; and the unemployment rate is 3.8%.
Total projects in Nundah is currently $13 million, but after the floods earlier this year destroyed Toombul Shopping Centre, new plans are already in the works to build a new central hub in the area.
6. Birkdale suburb profile
Lastly, Birkdale is also further out at 16.3kms from Brisbane with a median unit price of $458,000.
Annual median price growth was 5.7%*; the vacancy rate is 0.3%; rental yield is 5%; $5 million in total projects; and the unemployment rate is 2.8%.
*Median price growth captures sale transactions from 1st January 2021 to 31st March 2022, other figures current from March 2022
Gold Coast: Are investors striking gold?
Median property prices shot up to $940,000 over the past two years, while unit prices increased 16.7% to $595,000.
Sales on the Gold Coast also declined over the past year by 28.5% for houses and 34.8% for units.
However from the September quarter 2021 to the March quarter 2022, the Gold Coast Metro's median house price grew by 21.8% and 9.1% for units.
Over this period property sales grew 55.1% for houses and 104.4% for units.
The Gold Coast Metro's house market shows continued signs of growth, but at a slower rate, which is welcome news for buyers.
This is while its unit market is showing a higher pace of growth, fuelled by deeper undersupply when compared to houses.
Dr Diaswati Mardiasmo, Chief Economist at PRD, said the Gold Coast has a "two-speed property market".
With $2.8 billion in projects planned for the first half of the year for both mixed-use and residential projects (mainly read-to-sell units), this will create a more balanced property market and sustainable price growth for the unit sector.

Source: PRD Real Estate
Gold Coast's top suburb performers in 2021/22
PRD also collated its top suburb performers scattered across the region.
| Suburb | Type | Median price 2020 | Median price 2021/22 | Price growth |
| Surfers Paradise | House | $1,715,000 | $2,100,000 | 22.4% |
| Southport | Unit | $375,000 | $445,000 | 18.7% |
| Nerang | House | $516,000 | $671,000 | 30.2% |
| Coomera | Unit | $439,000 | $500,000 | 13.9% |
| Burleigh Waters | House | $945,000 | $1,315,000 | 39.2% |
| Burleigh Waters | Unit | $580,000 | $800,000 | 37.9% |
| Carrara | House | $628,000 | $850,000 | 35.4% |
| Carrara | Unit | $480,000 | $560,000 | 16.7% |
Source: PRD Real Estate
House rent prices increase 20.6% over the past year
House rental yields in the Gold Coast Metro area were 4.6% in the March quarter.
Median house rents rose to $720 per week. Three bedroom houses recorded the highest annual rental growth of 18.2% to $650 per week.
Three bedroom units recorded 20% annual rental growth to $600 per week.
According to PRD, this further cements the attractiveness of a higher bedroom count as an investment choice.
The Gold Coast Metro recorded a low vacancy rate of 0.4%, which should provide greater confidence to investors.
Which Gold Coast suburbs are still 'affordable and liveable'?
PRD's six suburbs to watch on the Gold Coast are:
- Oxenford
- Carrara
- Mudgeeraba
- Upper Coomera
- Robina
- Runaway Bay
References to Gold Coast's 'CBD' mean Southport, 4215.
1. Oxenford suburb profile
Oxenford is 10kms from the Gold Coast CBD with a current median house price of $750,000.
Annual median price growth is 32.7%*; the rental vacancy rate is 0.1%; rental yield is 4.6%; $4.8 million in total projects underway; and the unemployment rate is 4.1%.
2. Carrara suburb profile
Carrara is only 5kms from the CBD with a median house price of $850,000.
The annual median price growth was 35.4%; the vacancy rate is 0.2%; rental yield is 4.5%; $10 million in total projects; and the unemployment rate is 4.8%.
3. Mudgeeraba suburb profile
Mudgeeraba is located 12kms from the Gold Coast CBD with a median house price of $930,000.
Annual median price growth was 33.8%*; the vacancy rate is 0.5%; rental yield is 4.5%; $1.6 million in total projects; and the unemployment rate is 3.8%.
4. Upper Coomera suburb profile
Upper Coomera is a bit further out at 15kms from the city with a median unit price of $450,000.
Annual median price growth was 10.3%*; the vacancy rate is 0.3%; rental yield is 5.3%; $71.8 million in total projects; and the unemployment rate is 4.1%.
5. Robina suburb profile
Robina, which is located 10kms from the Gold Coast CBD, has a median unit price of $570,000.
Annual median price growth was 12.9%*; the vacancy rate is also 0.3%; rental yield is 5.7%; $12.2 million in total projects; and the unemployment rate is 3.7%.
6. Runaway Bay suburb profile
Lastly, Runaway Bay is a short 6km drive from the CBD with a median unit price of $592,000.
The seaside suburb saw annual median price growth of 12.9%*; the vacancy rate is 0.4%; rental yield is 5.6%; $2.9 million in total projects; and the unemployment rate is 4.1%.
*Median price growth captures sale transactions from 1st January 2021 to 31st March 2022, other figures current from March 2022
If you would like to read the full reports, you can access them by heading to - https://www.prd.com.au/research-hub/article/affordable-liveable-property-guide-1st-half-2022/
Advertisement
Buying a home or looking to refinance? The table below features home loans with some of the lowest interest rates on the market for owner occupiers.
| Lender | Home Loan | Interest Rate | Comparison Rate* | Monthly Repayment | Repayment type | Rate Type | Offset | Redraw | Ongoing Fees | Upfront Fees | Max LVR | Lump Sum Repayment | Additional Repayments | Split Loan Option | Tags | Row Tags | Features | Link | Compare | Promoted Product | Disclosure |
|---|---|---|---|---|---|---|---|---|---|---|---|---|---|---|---|---|---|---|---|---|---|
5.79% p.a. | 5.83% p.a. | $2,931 | Principal & Interest | Variable | $0 | $530 | 90% |
| Promoted | Disclosure | |||||||||||
5.74% p.a. | 5.65% p.a. | $2,915 | Principal & Interest | Variable | $0 | $0 | 80% |
| Promoted | Disclosure | |||||||||||
5.84% p.a. | 6.08% p.a. | $2,947 | Principal & Interest | Variable | $250 | $250 | 60% |
| Promoted | Disclosure |
Image by Brisbane Local Marketing on Unsplash

Ready, Set, Buy!
Learn everything you need to know about buying property – from choosing the right property and home loan, to the purchasing process, tips to save money and more!
With bonus Q&A sheet and Crossword!


 Denise Raward


 Emma Duffy
 Brooke Cooper
