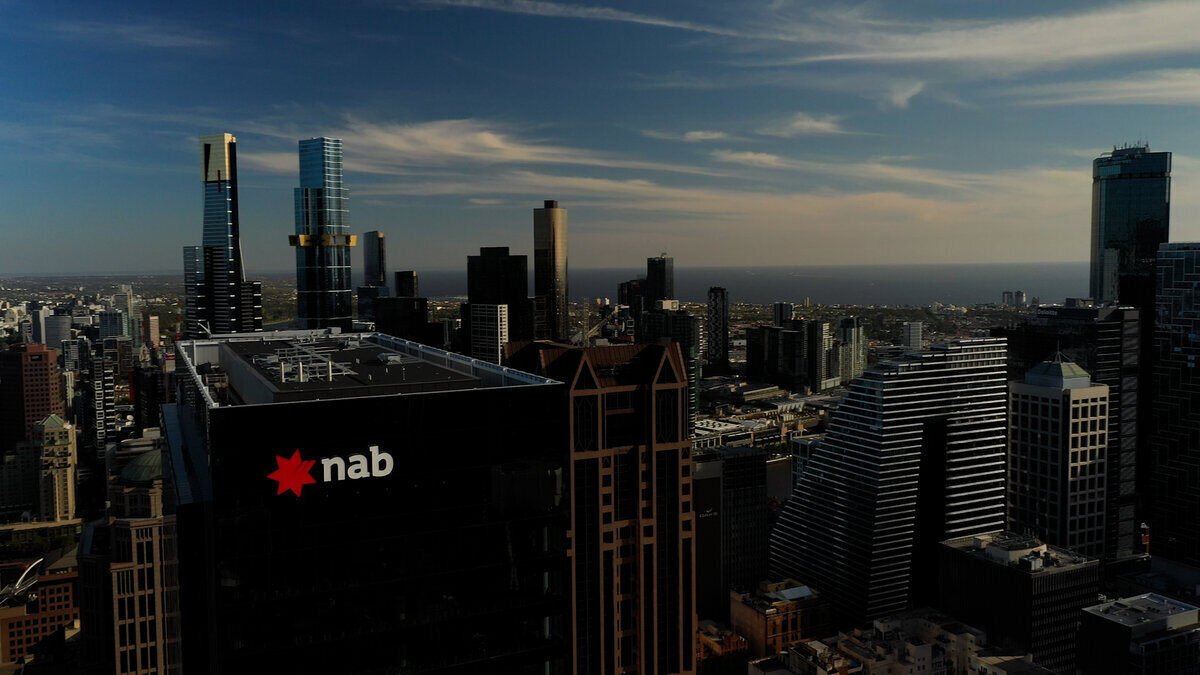
RiskWise Property Research CEO Doron Peleg said while price reductions of 11% to 15% in these two cities respectively had significantly improved affordability, houses in NSW remained the most unaffordable in Australia, with houses in Victoria not far behind.
“While housing affordability has improved, the price-to-income ratio as well as mortgage serviceability ratio are still very high,” Mr Peleg said.
“This is largely due to the strong population growth in these major cities that lead to price increases and, as we projected following the May election results, a removal of the uncertainty regarding political changes and the forecast taxation reforms had Labor won.”
Mr Peleg echoed ANZ and CoreLogic sentiment that house prices were set to skyrocket in 2020, and pointed to strong job prospects as a reason for the population boom.
“The key problems we have is imbalances between house and unit supply compared to the very strong population growth in what are effectively global cities,” he said.
“This population growth is largely driven by strong employment opportunities in these multicultural cities that receive external migrants extremely well.”

The link between employment, population and property prices has been evidenced in the positive price growth in NSW and Victoria.
While on the other hand, Perth and Darwin were hit hard by the end of the mining boom, with population dwindling as job seekers went interstate.
As a result, house prices have either stagnated or fallen further.
Mr Peleg said Sydney and Melbourne’s population growth, job creation, improving economy and infrastructure would draw even more people to these cities and further drive up property demand.
Population forecasters expect both cities to hit the eight million residents mark by 2050.

Mr Peleg said the current environment of high prices would make it increasingly difficult to compete with property investors.
“We expect to see investors increase their activity in the market as it is currently well below peak and this will put further pressure on dwelling prices and housing affordability,” he said.
What’s the solution?
Mr Peleg said the imbalances in the market could not be solved without a strategic solution and co-ordinated plan by all levels of government.
He pointed to the 2018 ‘Building Up & Moving Out’ report from the Standing Committee on Infrastructure, Transport and Cities as a step in the right direction.
The report recommends the Australian Government:
- Develop a framework for the development of cities and regions outside the major metropolitan centres;
- Undertake the development of transport networks which allow for fast transit between cities and regions;
- Ensure urban and regional infrastructure is developed; and
- Appoint a Minister for Cities and National Settlement
“By reducing the population of major cities and encouraging people into regional areas, you affect supply and demand of housing and, therefore, affordability. If there is less demand, it follows that prices should drop,” Mr Peleg said.
“The solution is to encourage development of larger regional areas and ensure they are well serviced by infrastructure and jobs to attract people away from the traditional employment hubs.”
Second busiest week auction week for 2019
There were 2,571 homes taken to auctions across the combined capital cities this week, up from 2,412 over the previous week according to CoreLogic’s auction statistics.
Preliminary results show a clearance rate of 74.1, compared to last week’s final clearance rate of 70.6%.
The same time last year saw 2,745 auctions held across the combined capitals, with only 42.0% returning a successful result.
Melbourne was the busiest week for the capitals, with 1,241 homes taken to auction returning a preliminary clearance rate of 77.0%.
It was the second busiest auction week for the Victorian capital, while the same time last year saw a clearance rate of 41.3% across 1,401 auctions.
Sydney saw 932 homes taken to auction with a preliminary clearance rate of 77.2%.
The previous year saw 875 auctions held, returning a final clearance rate of 42.8%.
Adelaide saw an increase in auction volumes week-on-week, while Brisbane, Canberra, Tasmania and Perth all had subdued activity.
| City | Clearance rate | Total auctions | CoreLogic auction results | Cleared auctions | Uncleared auctions | Clearance rate (2018) | Total auctions (2018) |
| Sydney | 77.2% | 932 | 711 | 549 | 162 | 42.8% | 875 |
| Melbourne | 77.0% | 1,241 | 1,024 | 788 | 236 | 41.3% | 1,401 |
| Brisbane | 45.1% | 124 | 82 | 37 | 45 | 34.9% | 182 |
| Adelaide | 60.6% | 149 | 94 | 57 | 37 | 59.0% | 114 |
| Perth | 52.6% | 42 | 19 | 10 | 9 | 28.0% | 58 |
| Tasmania | N/A | 5 | 3 | 1 | 2 | N/A | 8 |
| Canberra | 79.0% | 78 | 62 | 49 | 13 | 48.5% | 107 |
| Weighted average | 74.1% | 2,571 | 1,995 | 1,491 | 504 | 42.0% | 2,745 |
Source: CoreLogic

Ready, Set, Buy!
Learn everything you need to know about buying property – from choosing the right property and home loan, to the purchasing process, tips to save money and more!
With bonus Q&A sheet and Crossword!


 Harry O'Sullivan
 Harrison Astbury
 Bernadette Lunas


