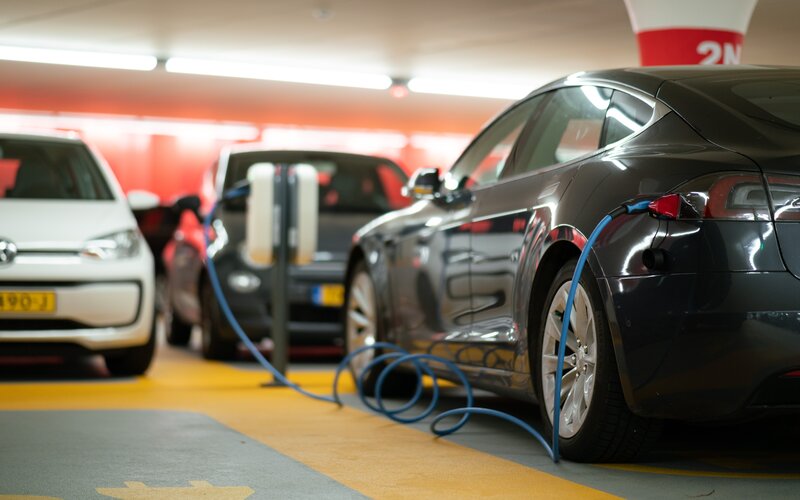
November's sales were up 12.4% compared to November last year, up to 95,205 units from 84,708, according to the Federal Chamber of Automotive Industries' (FCAI) 'VFACTS' report.
October's results were down just 1.5%, marking 31 consecutive months of decline.
In the market for a new car? The table below features car loans with some of the lowest fixed and variable interest rates on the market.
| Lender | Car Loan | Interest Rate | Comparison Rate* | Monthly Repayment | Interest Type | Vehicle Type | Maximum Vehicle Age | Ongoing Fee | Upfront Fee | Total Repayment | Early Repayment | Instant Approval | Online Application | Tags | Row Tags | Features | Link | Compare | Promoted Product | Disclosure |
|---|---|---|---|---|---|---|---|---|---|---|---|---|---|---|---|---|---|---|---|---|
5.99% p.a. | 7.12% p.a. | $580 | Variable | New | No Max | $8 | $400 | $34,791 |
| Promoted | Disclosure | |||||||||
6.52% p.a. | 6.95% p.a. | $587 | Fixed | New, Used | No Max | $0 | $350 | $35,236 |
| Promoted | Disclosure | |||||||||
6.57% p.a. | 7.19% p.a. | $588 | Fixed | New | No Max | $0 | $250 | $35,278 |
| Promoted | Disclosure |
FCAI chief Tony Weber welcomed the positive turnaround.
“Why are we seeing an improvement now? We believe there are a few contributing factors, including rising optimism from the Australian public as COVID-19 restrictions ease," Mr Weber said.
“This increase in consumer confidence is backed by government support programs during the pandemic, the easing of lending restrictions, and the current competitive automotive market.
“We also believe that, given our inability to travel internationally, many Australians are choosing to purchase a new vehicle and holiday at home this year – and we fully expect to see a notable increase in family driving trips over the Christmas season."
Year-to-date, however, sales are down 16.1% on the same period last year.
In total, SUVs claimed 52.5% of the market share in November, and light commercial vehicles (utes, vans etc.) claimed 22.3%.
Of the top ten-selling vehicles, just two (in bold) weren't an SUV or ute.
- Toyota HiLux - 5,038
- Ford Ranger - 4,260
- Toyota RAV4 - 3,800
- Toyota Landcruiser - 2,947
- Toyota Corolla - 2,774
- Toyota Prado - 2,602
- Mazda CX-5 - 2,412
- Isuzu D-Max - 2,095
- Hyundai i30 - 2,047
- Hyundai Tucson - 1,995
In the top ten, the Toyota Prado posted the biggest gain on November 2019's sales, up 116.1%.
Passenger vehicle (hatchbacks, sedans) sales continued to dwindle, down 10.1% compared to November 2019.
Throughout the pandemic, used car sales' values have been soaring according to Moody's Analytics.
The 'utility' segment, which includes utes and SUVs, had increased 32% in value, however Moody's auto economist Michael Brisson in August said this could be short-lived.
Used car sales' rising values in 2020 have coincided with new car sales dwindling.
Photo by Frankie Dixon on Unsplash





 Denise Raward
 Harry O'Sullivan

 Brooke Cooper
 Harrison Astbury